


Discover how Sinay optimized its AI video processing infrastructure to handle thousands of maritime monitoring videos daily while reducing GPU costs by 62% using scalable
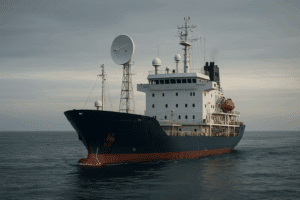
LoRa, NB-IoT, and Satellite Mesh are key technologies in maritime IoT, driving smarter vessel operations and improving marine environmental monitoring.