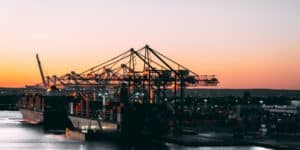

When we talk of the global supply chain, port efficiency acquires the role of the protagonist. Port efficiency shapes a country trade’s competitiveness. For ship management organizations, owners, brokers, and suppliers; port efficiency, accessibility, and proximity are decision-making factors-all of which have time as the dimension.
In ocean shipping, Vessel Turnaround Time- the time frame of arrival and departure of the vessel at a port- turns out to be the most influential factor in operations and counting efficiency of the same. There have been numerous studies that propose several indicators as a measure of Port efficiency; UNCTAD in 1976 rolled out a list of finance and operational indicators, Turnaround time being one of the vital factors.
Significant variations depending on the country, companies, ports
As per Statista Research Team, dry cargo container ships spent around 0.69 days in a port during port calls. Comparing median time, Japan is found to be the best performer with 0.35 days and Australia, the worst with a median time of 1.18 days. UNCTAD reports declare that the median ship turnaround time is 0.97 days globally.
Moreover, the average turnaround time illustrating the capability of the port to handle cargo flow at the port terminals efficiently, surely depends on several factors.
- Transit Time– There has been a wide claim among studies and research journals that transit time affects overall turnaround time. A wide number of characteristics affect transit time. It varies from vessel dimension, registration, ownership, shipping network followed, and investment on inland connections. Moreover, other range of factors including weather, tidal conditions, mechanical failings, and congestion in the previous port of call. Unpunctual arrival might lead to the unprepared terminal, disrupted operations, and allocation of the berth and crane assistance to the other ship.
Drewry Carrier Performance reports 2013 provide us with punctuality data scores that have enlisted Maersk, Evergreen, and Yang Ming as the top formers. These data closely accord with them yielding the best percentage positive results among Ocean container carriers cited in ‘Ship Turnaround Times in Port: Comparative Analysis of Ocean Container Carriers’. Evergreen emerged as the leader with only one of the 12 ports of call whose times below the port average. Yang Ming claimed second place with 10 of its 12 port calls, and Maersk in third place with 14 out of 17 port calls being shorter than the port averages.
However, MSC and CSA V possessed the worst punctuality rankings in 2013, not in line with the ATT rankings. Detailed linking of carrier punctuality and Average Turnaround time requires further research.
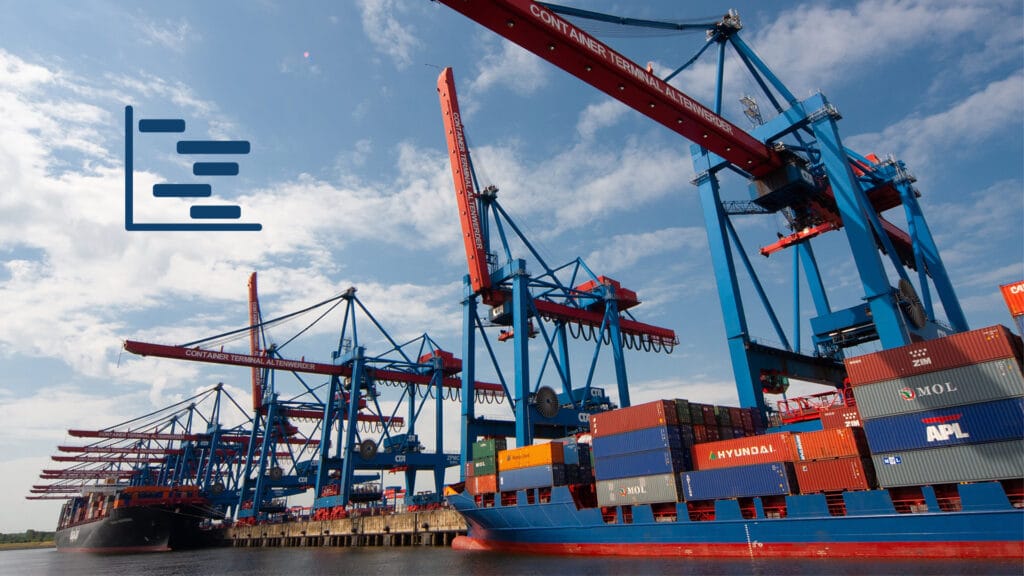
Stowage Plans– Berth Allocation is the preliminary stage of port operations. Dwell time- is the time for which the ship has to wait for the allocation of a berth. It primarily depends on several factors which include dimensions of the ship, type of cargo, cargo volume, and its handling methods. It further impacts the stowage plan, crane productivity, and operations.
A stowage plan is made for the entire route of the vessel that describes the allocation of space on board the ship for the cargo containers without disturbing the prior container set-up along the way. Institute of Shipbrokers (2013) suggested Working Vessel Output as one of the parameters for Port Performance Measurement.
Working Vessel Output = Total tonnage handled (tonnes/vessel hour worked)/ Total hours worked.
Whereas, APM terminals defined gross moves per hour and crane productivity ( Number of containers handled by one crane /Total hours worked with the crane) as one of the influential factors in determining Port Efficiency. To add, stowage plans necessarily impact these parameters, affecting the overall port efficiency.
- Transit Time– There has been a wide claim among studies and research journals that transit time affects overall turnaround time. A wide number of characteristics affect transit time. It varies from vessel dimension, registration, ownership, shipping network followed, and investment on inland connections. Moreover, other range of factors including weather, tidal conditions, mechanical failings, and congestion in the previous port of call. Unpunctual arrival might lead to the unprepared terminal, disrupted operations, and allocation of the berth and crane assistance to the other ship.
Generally, a human planner with the assistance of optimization programs produces a stowage plan specific to a ship and the cargo it is carrying.
How to Track a Ship In Real-Time ?
Let us look at how a ships’ real-time tracker works, its details and features, its benefits for all players in the shipping sector but also its weaknesses…
So, what’s the escape to high vessel turnaround time?
Better vessel reliability and route forecast would ease the process to achieve more efficient port operations and efficiency. As stated by eeSea, it was found that more than 50% of the vessels were delayed more than 8 hours while 10% of them were reported to arrive 3 days later than the estimated time over the year 2019.
As per the SeaIntel 2017 reports, OOCL, Evergreen, and WanHai were the top performers among 18 carriers and over 38,000 arrivals. OOCL with 83.3% vessel reliability gave credits to the organization’s interest and investment in the IT sector to achieve such a great feat. OOCL was the first in the maritime industry to adapt and offer an e-commerce platform and its consistent efforts towards digitizing and creating an integrated system with processes of all OOCL offices, customers’ shipments, and financial information through its IRIS platform has helped it achieve this great feat of maintaining high vessel reliability and operational efficiency.
When it comes to achieving higher vessel reliability, a parameter with time as its dimension, then the route forecast seems nothing less than ‘Godfather’. Advanced weather routing was conceptualized and proposed as a solution to the fuel oil consumption minimization problem. Later, its influence was established on each element of port efficiency and operations.
Transit time, as stated, above is a vital factor in port efficiency which has its fate cultivated in ship routing. Ship routing not only acts as a blueprint to the vessel for better punctuality and reliability but also ensures better environment-friendly trade operations through a route with better fuel-efficient optimization.
Route planning based on vessel type and dimension, cargo type, and destination, admits the following parameters into its threshold while building the optimal route:
- Weather Forecasts.
- Optimum Speed Recommendations.
- Economical Shipping Routes in terms of Fuel Efficiency.
Shipowners focus on crew efficiency
The route forecasting and a modern route planning system would suffice both sides of the coin, the crew to cultivate better efficient operations out of them and shipowners edge over perfect and timely execution of the ETA, stowage plans, crane operations, and the better vessel turnaround time.
Let us know route forecast would facilitate crew to attain a better efficiency:
- Advance and strategic planning for the shipping company specific to the route.
- Better decision-making ability of the captain along with crew because of preparedness to carry out any sudden operations owing to the weather.
- Routing in line with the required time arrival.
- Routing in line with the least need of changing speed, therefore maintaining the same power.
- Facilitating timely transit with detailed local traffic and stowage plans.
Moreover, a timely transit instills an energy efficiency culture with instantaneous berth allocation with the least dwell time. Further, it promotes an efficient stowage plan and much better crane productivity; all boosting the port efficiency and an eased supply chain.
Frequently Asked Questions About: VESSEL TURNAROUND TIME
A 3 day turnaround time means the item will be delivered in 3 days.
Turnaround time does not include shipping because it does not include the transit time.
Order turnaround time is the time once your item is shipped to the moment of its receival.
Unloading a large ocean container ship can take 1-3 days.
Turnaround time = Exit time – arrival time