Zone Statistics (coming soon)
Analyze any maritime zone from your dashboard
How does Zone Statistics work?
Zone statistics enables the shipping industry and ports to analyze data and calculate statistics for certain zones. The data collected and statistics shown can be for a number of reasons. For example, a shipping company can choose to select a zone in order to identify weather statistics, transport statistics, safety and security statistics, route statistics, or wave statistics. A port can choose to identify a zone in order to see vessel traffic statistics, port congestion, or environmental statistics. Zone statistics use data from a set area compared to as in general and provide specific statistics for this.
The maritime industry, shipping industry, and ports provide tons of data. This data can be used to provide essential statistics for the maritime industry. With global trade and sea transport increasing each year, it is important that ports and the shipping industry have access to key data to help with port congestion, transportation, and freight processing. The data can be used in many ways and dividing areas into zones is just one way to take advantage to the massive amount of data produced by the maritime industry each year.
Only 5 access per week
They trust us


Benefits
Zone statistics analysis

Analyze data and calculate statistics for certain zones

Identify weather statistics, transport statistics, safety and security statistics, route statistics, or wave statistics

Have access to key data to help with port congestion, transportation, and freight processing

Using AI for maximum efficiency
Why should you use
Zone Statistics?
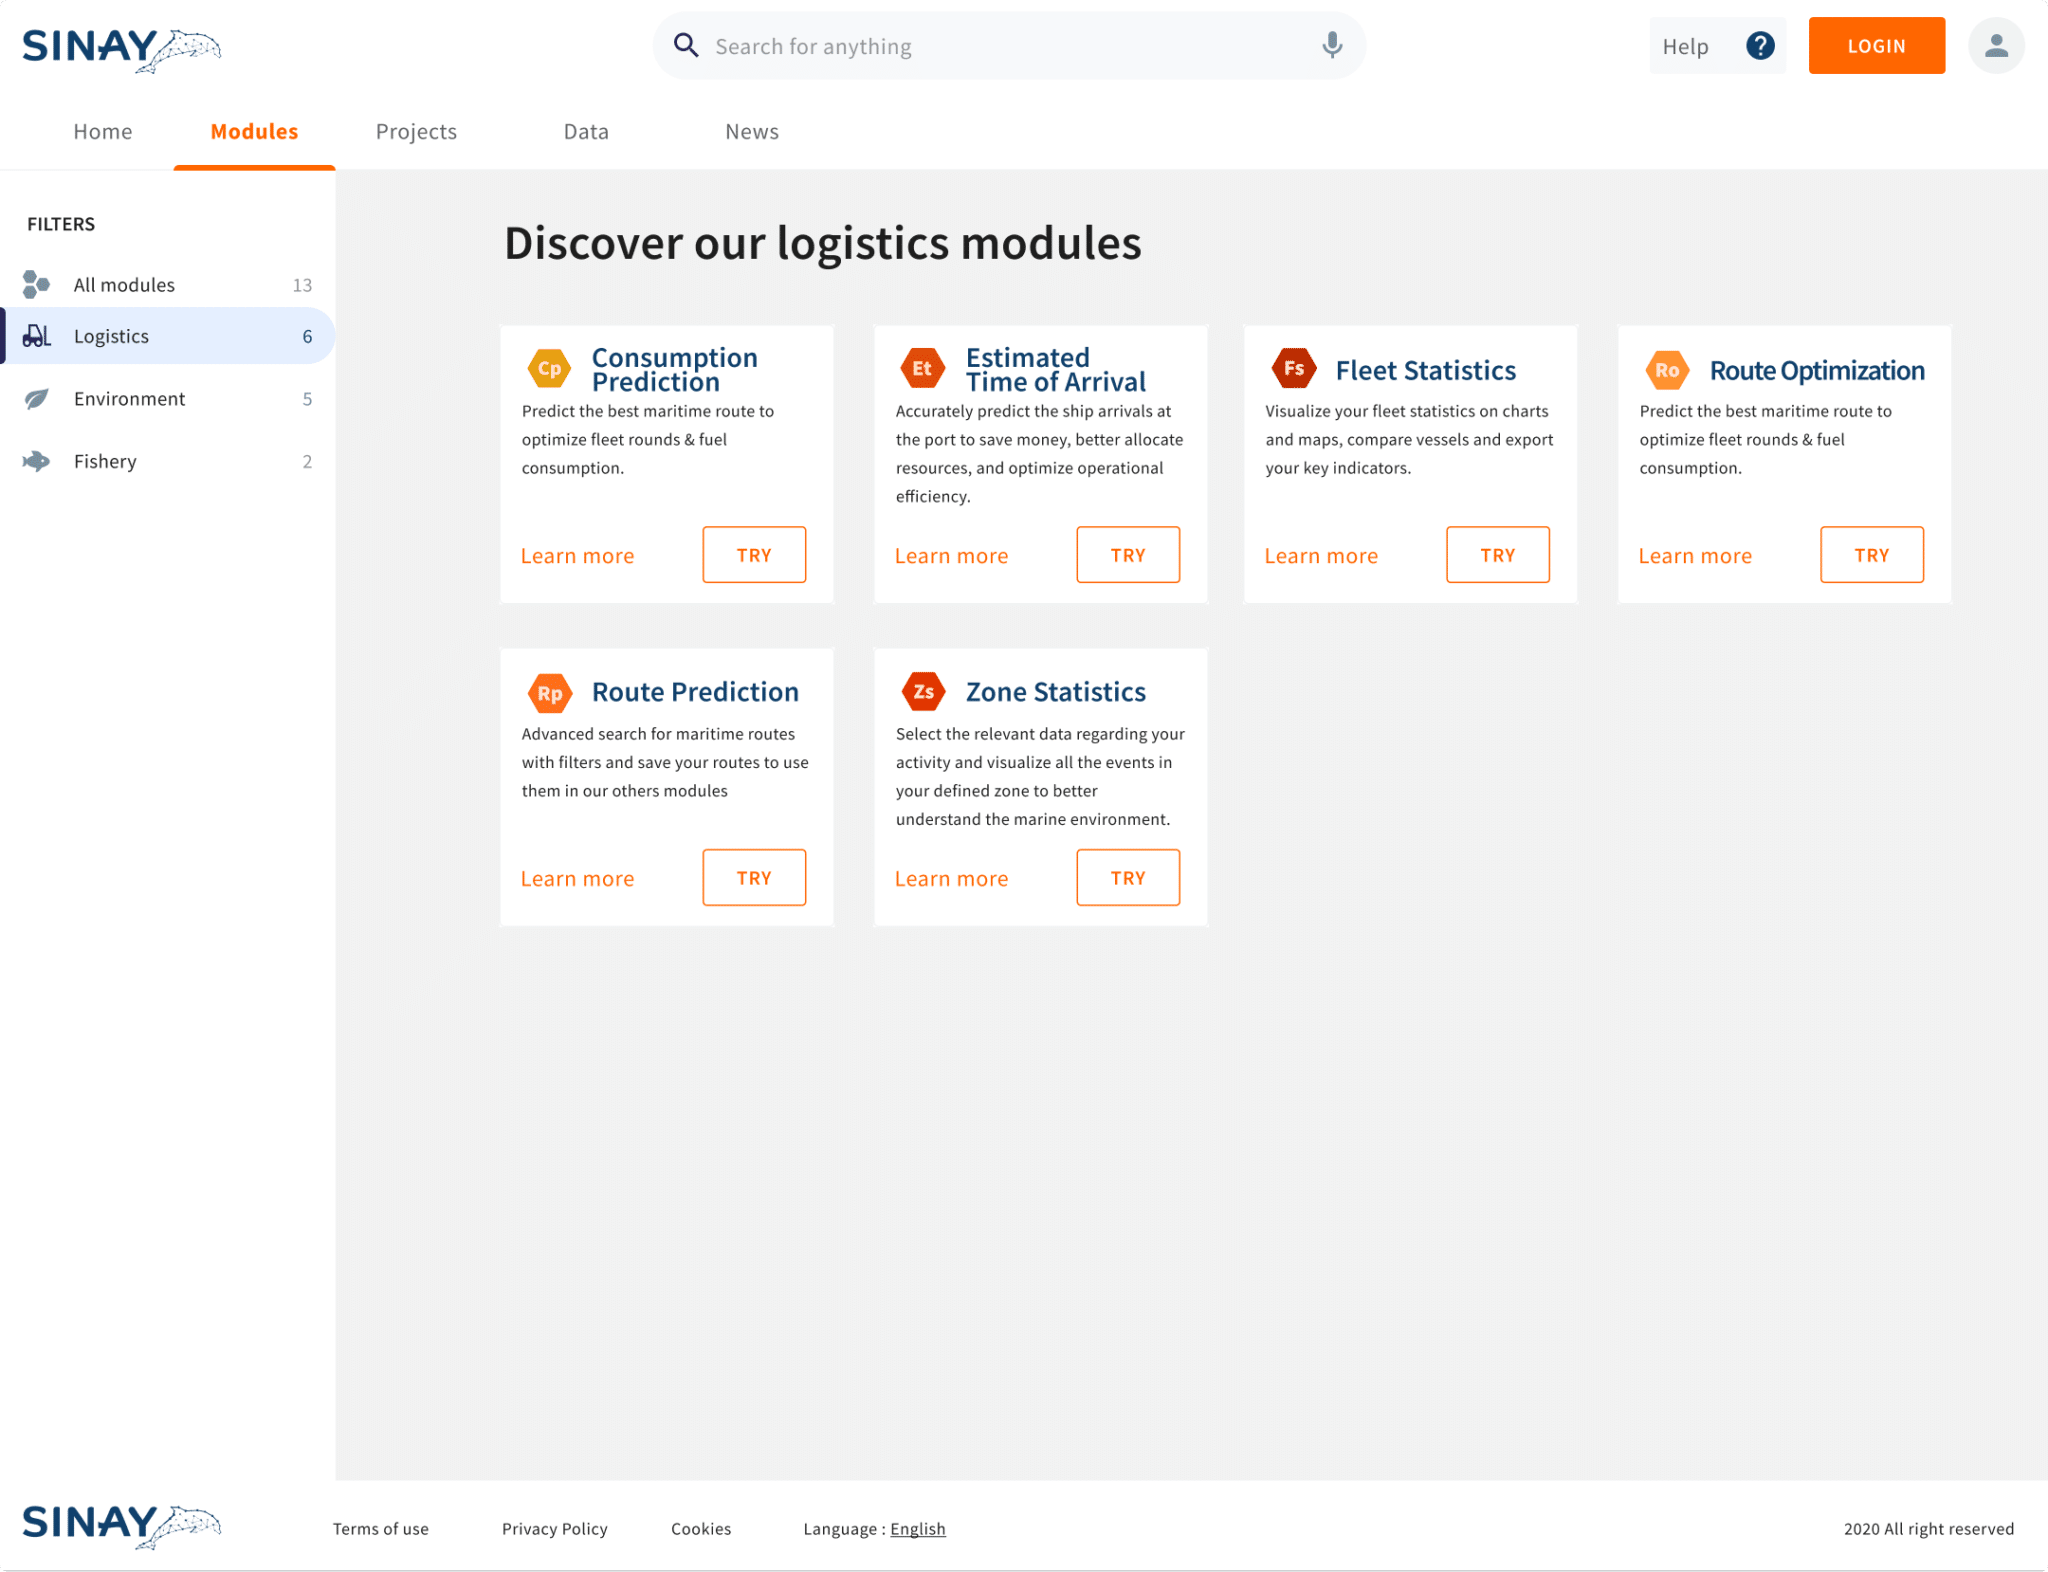
The Sinay Zone Statistics Module enables shipping companies and ports to select relevant data regarding their activity and to visualize all the events in their defined zone to better understand the marine environment. The zone is chosen by user and can range in size and place. The Zone Statistics Module collects data from multiple sources.
Interested in testing our Zone Statistics Module?
Focus on logistics data to make an effective decision
Discover Our Modules
Choose the needed logistic module, either to predict ETA, choose the best route plan, predict consumption, or know important statistics. Increase value chain efficiency, save time and money, and reduce your environmental footprint. Each module lets you solve specific key pain points thanks to the IoT connected sensors.
Logistics Efficiency
Accurately predict the ship arrivals at the port to save money, better allocate resources, and optimize operational efficiency.
Start using our ETA Calculator Module for free and get an accurate prediction in just a few clicks.
Easily integrate Sinay’s vessel ETA Calculator into your system by API. Provide accurate predictions thanks to our AI models.
Predict the best maritime route to optimize fleet rounds & fuel consumption.
Advanced search for maritime routes with filters and save your routes to use them in our others modules.
Predict the best maritime route to optimize fleet rounds & fuel consumption.
Visualize your fleet statistics on charts and maps, compare vessels and export your key indicators.


